There’s a tech-driven shift in lacrosse that puts advanced sensors, AI analytics, and wearable monitoring at your fingertips. You can use these tools to extract precise metrics, gain tactical edge, and achieve performance gains, while harnessing real-time feedback to adjust training and reduce contact-related harm. Be aware of data privacy concerns and device reliability as potential hazards, and adopt validated systems to protect your safety and optimize your results.
Key Takeaways:
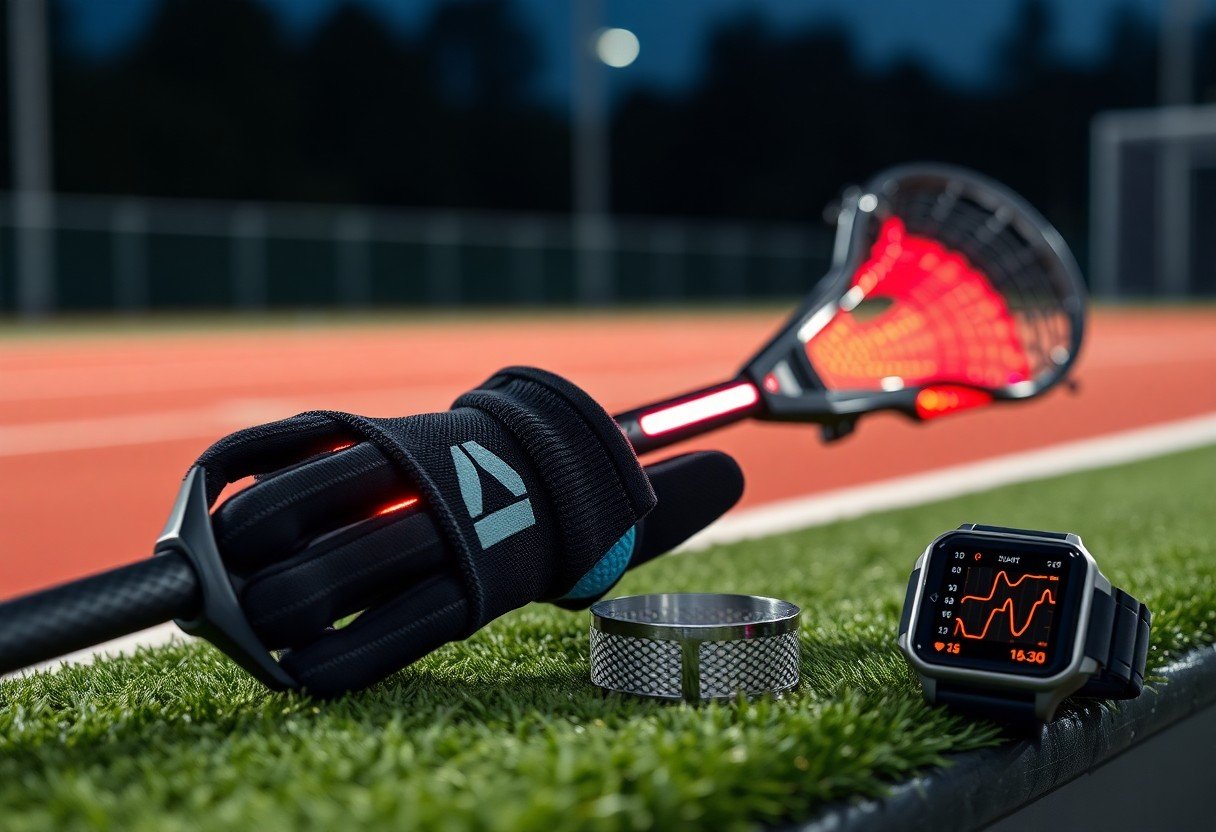
- Wearable sensors and GPS-enabled devices quantify speed, workload, and impact forces for performance monitoring and injury mitigation.
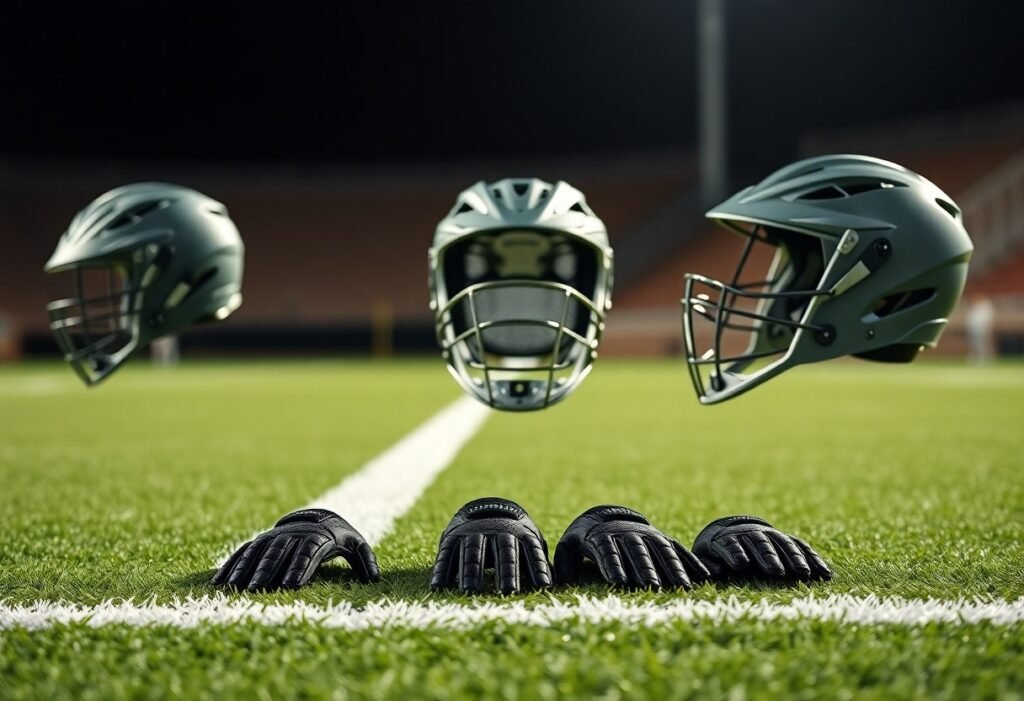
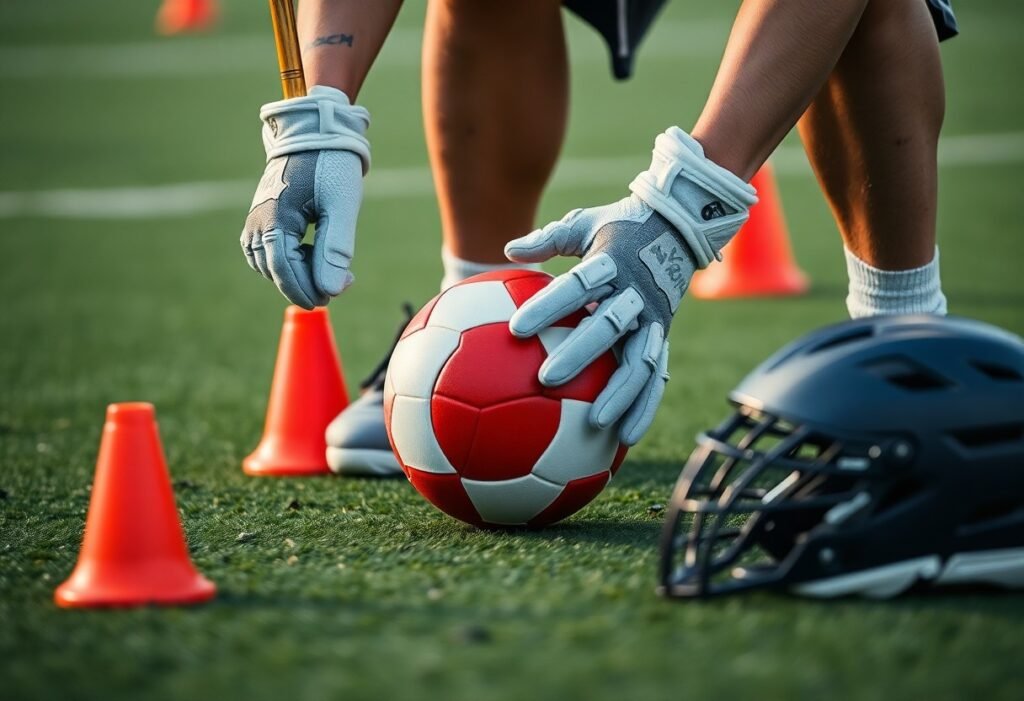
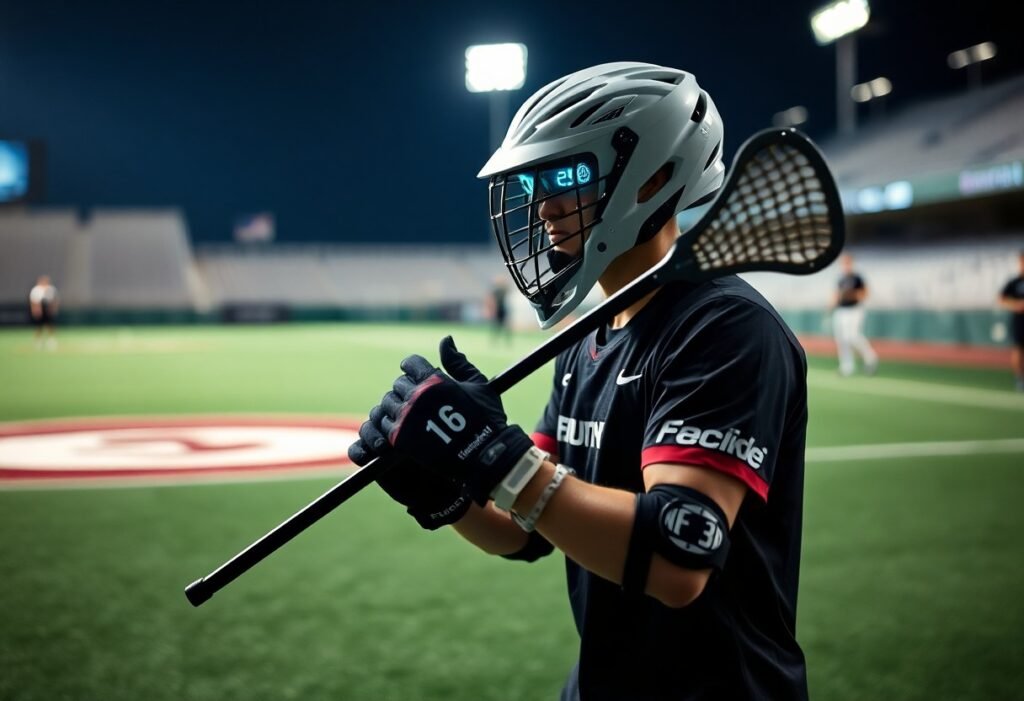
- Sensor-integrated sticks, smart helmets, and connected balls deliver real-time technique metrics and impact alerts to enhance skill development and safety.
- AI-driven analytics and video tracking convert player data into tactical insights and personalized training plans.
The Evolution of Lacrosse Technology
Historical Overview
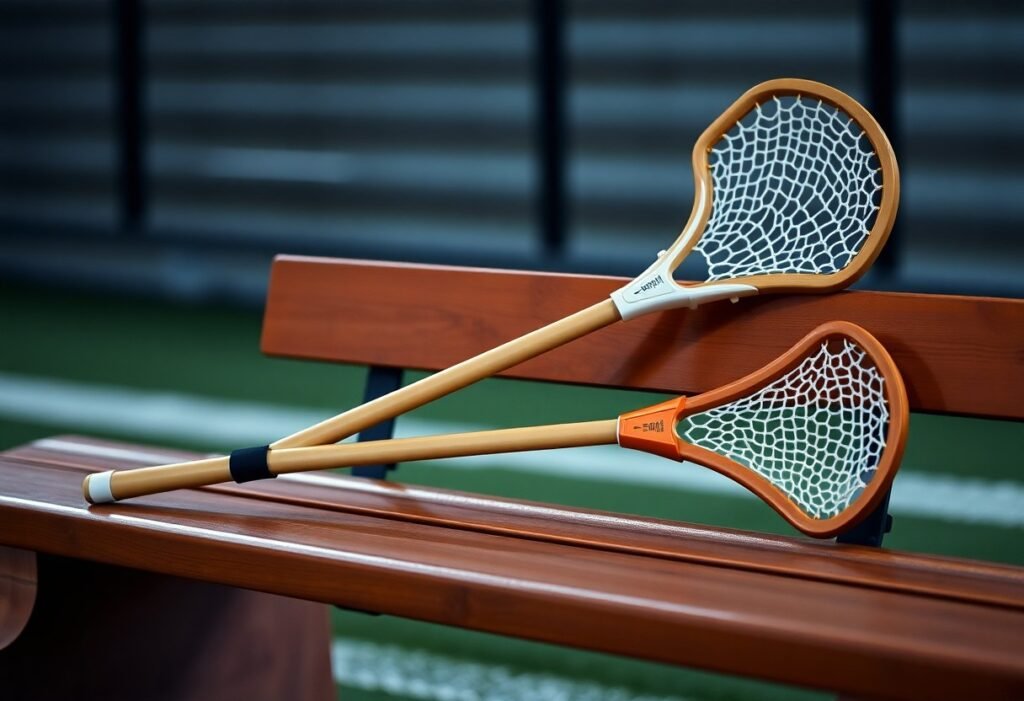
From the sport’s Indigenous origins, you see a clear arc. Hand-carved wooden sticks gave way to mass-produced plastic heads by the 1970s. Synthetic mesh pockets arrived in the 1980s, speeding break-in and improving consistency.
Protective helmets and pads improved as collisions intensified. Growing awareness of concussion risk pushed rule changes and helmet design advances. These developments continued through the 1990s and into the 2010s.
Key Innovations
Mesh pockets, carbon-fiber shafts, and offset head geometry redefined ball control and shot power. You now watch players regularly exceed 100 mph on radar tests. Brands like STX and Warrior led this rapid iteration. Wearable GPS and inertial sensors entered pro programs in the 2010s. These devices give teams valuable metrics. They show athletes cover roughly 4-6 miles per game. They also track repeated high-intensity sprints.
Mesh made from nylon or polyurethane cut water absorption significantly. It slashed break-in time from weeks to just days. Composite shafts improved stiffness-to-weight ratios for faster shaft recovery. Offset heads increased ball retention during cradling and dodging.
Sensors now measure shot velocity, player load, and recovery. These metrics let you tailor training and equipment choices. This approach helps reduce injury risk and boost on-field efficiency.
Smart Equipment in Lacrosse
You can rely on embedded sensors across gear to provide objective metrics. GPS and accelerometers quantify distance and acceleration. Head and mouthguard sensors flag significant impacts.
Teams use 10-15 Hz GPS and IMUs sampled at 100-1000 Hz. These tools spot workload spikes and potential concussion-level hits. Coaches can then adjust drills and substitution patterns. Several collegiate programs report lower soft-tissue injury rates after adopting sensor-driven load management.
Wearable Technology
You’ll wear vests, sleeves, or mouthguards packed with GPS, heart-rate, and IMU sensors that log speed, distance, and impacts. Typical setups combine 10-15 Hz GPS with IMUs at 100-1000 Hz and batteries lasting 6-12 hours. Real-time alerts for high-impact events and workload spikes let you reduce overuse risk and monitor cumulative head-impact exposure during practices and games.
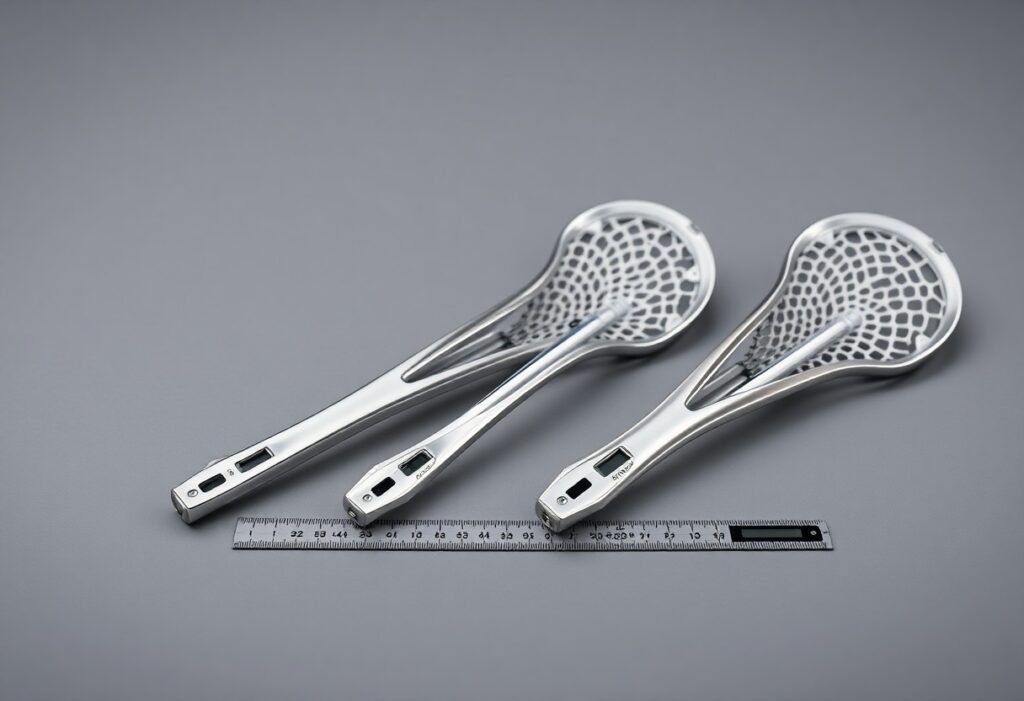
Smart Balls and Sticks
You outfit balls and sticks with embedded IMUs and optical markers. These measure shot velocity, release angle, and spin in mph and RPM. Sensors sampling at 100-500 Hz let you quantify shots exceeding 90+ mph. They also pinpoint milliseconds of release timing. This helps you isolate mechanical flaws. You can track technical gains from session to session.
More detail: sensors stream metrics to apps with real-time feedback, pairing video for context; typical latency stays below 200 ms so you can correct form instantly. You can program drills-target zones, progressive difficulty-and export CSVs for deeper analysis. Rugged, water-resistant housings and 8-12 hour battery life make devices practical across games and multiple practice sessions.
Data Analytics in Lacrosse
Wearables and video tracking let you quantify player load, sprint distance, and shot location. These systems often sample at 10 Hz and 60 fps. Teams use this data to refine training and tactics.
They build KPIs like high-intensity efforts per quarter and clear efficiency. Teams also deploy models such as expected possession value to rank actions. When you merge GPS, accelerometer, and event data, you generate actionable insights. These insights directly inform coaching decisions.
Performance Metrics
You monitor shot accuracy by zone, turnover rate, faceoff win percentage, and high-intensity sprint counts, with devices flagging load spikes above 15%. Using Catapult 10Hz GPS and heart-rate monitors, staff correlate those metrics with recovery windows and adjust workloads to lower soft-tissue injury risk. Dashboards let you compare season-to-date KPIs and prescribe individualized drills based on objective thresholds.
Game Strategy Enhancements
Analytics expose matchup advantages and high-value shot zones. You can shift defensive schemes or run plays targeting an opponent’s weak side. Heatmaps show many goals originate inside the inner 8 yards.
Video-tagged sequences and EPV metrics let you choose your tactics. You decide when to press and when to ride. You also learn which player-pairings maximize possession under pressure.
During matches, you fuse live GPS and event feeds to alter substitutions. You shorten shifts when a midfielder’s high-intensity effort count drops. You also exploit gaps after an opponent receives a yellow card. By doing so, you preserve sprint capacity across quarters and sustain defensive pressure. This produces measurable possession gains that translate into more scoring opportunities.
Training and Coaching Innovations
You can combine wearable GPS/IMU data (10 Hz GPS, 100+ Hz IMUs), frame-by-frame video and AI-driven analytics to individualize workload, refine mechanics, and spot fatigue patterns before they cause harm. For example, coaches use live dashboards to modify drills when sprint distance or high-intensity efforts exceed historic baselines, helping reduce overuse injuries and maximize practice efficiency while preserving match performance.
Virtual Reality and Simulation
Using VR platforms like STRIVR (adopted by NFL and NCAA programs), you rehearse reads, set recognition, and transition decisions without physical wear. Short micro-sessions-commonly 6-8 minutes, 2-3 times weekly-let you run hundreds of game-like rep scenarios, tighten decision speed, and simulate high-impact situations safely, so your instincts sharpen while contact-related injury exposure stays low.
Mobile Applications for Skill Development
Mobile apps such as Hudl and CoachNow, plus high-frame-rate capture and external radar, let you analyze release mechanics at up to 240 fps, tag drills, and track shooting percentage, shot velocity, and rep counts. You can assign individualized progressions, review annotated clips with players instantly, and export metrics to the team dashboard to spot technical trends across weeks or seasons.
Dive deeper by using pose-estimation tools (MediaPipe, OpenPose) to extract joint angles and measure release time down to ~4.17 ms with 240 fps video. Then correlate shot velocity (mph) and release delay to shooting percentage across practice blocks. Many coaches combine these metrics with GPS workload to build 30-60 day skill cycles, letting you quantify progress and adjust drills based on objective thresholds rather than feel.
Fan Engagement Through Technology
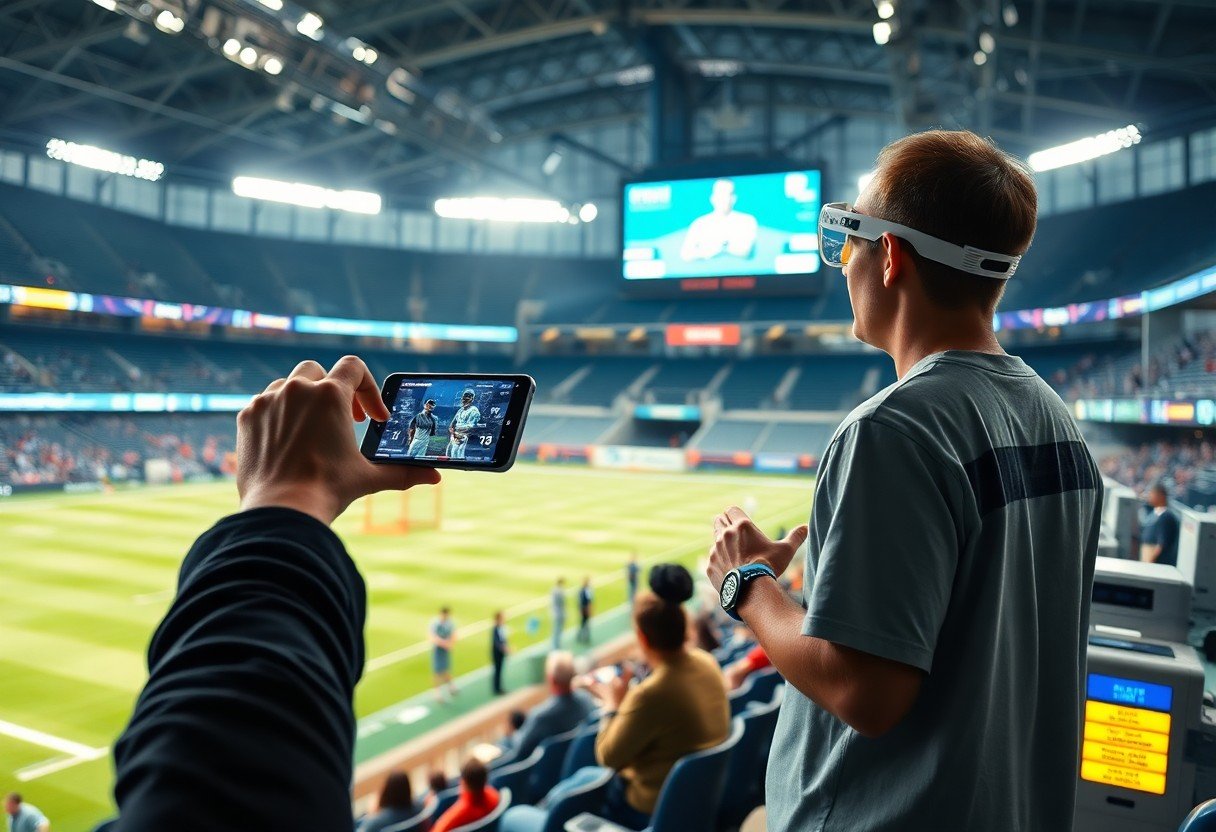
You tap into mobile-first strategies that push real-time stats, polls, and loyalty rewards to fans during games; over 50% of sports viewers use a second screen, so these features lift interaction. Teams tie gear stories to engagement – see The Evolution of Lacrosse Equipment: How Innovation Shapes the Game for gear-driven narrative hooks that boost retention.
Augmented Reality Experiences
You deploy AR to overlay player tracking, shot arcs, and 3D replays onto phones or jumbotrons; pilots have shown that contextual overlays-like isolating a midfielder’s stick movement or visualizing shot speed up to 100 mph-deeply increase comprehension. Combine stadium AR lenses with synced broadcast timestamps to ensure the overlays stay accurate and avoid perceptible lag.
Enhanced Viewing Options
You offer multi-angle 4K streams, player POVs, and high-frame-rate replays (commonly 120 fps) so fans can inspect mechanics without motion blur. Integrate toggles for analytics-possession sequences, expected-goal style metrics, or heat maps-to let your audience choose depth of analysis and extend average view times.
To deliver this you prioritize low-latency (<3s) streaming, adaptive bitrate CDNs, and 5-10 camera rigs including SkyCam or rail cams; additionally, player-worn sensors sampling at ~10-20 Hz feed live X/Y coordinates to graphics engines. That pipeline produces immersive, analytical viewing that turns casual watchers into engaged fans and supports targeted sponsorship activations.
The Future of Smart Tech in Lacrosse
You’ll see tight integration of 10-18 Hz GPS vests, 6-axis inertial sensors, and automated video analytics delivering real-time player-load and shot-mechanics feedback; several Premier Lacrosse League and NCAA Division I programs already combine Catapult-style GPS with Hawk-Eye-like tracking to reduce load spikes and refine set plays, turning raw sensor streams into actionable coaching cues within seconds.
Emerging Trends
You’ll notice sensor fusion (GPS + 6-axis IMU + optical tracking), edge computing leveraging sub-10 ms 5G links, and machine-learning models trained on thousands of plays to predict fatigue windows; teams are piloting AR overlays for practice and individualized load prescriptions tied to force-plate baselines to boost sprint recovery and shooting efficiency.
Potential Challenges
Data ownership, coach buy-in, and equipment costs remain barriers: GPS vests and sensors range from several hundred to a few thousand dollars each, youth programs often lack infrastructure to stream and store high-frequency (10-18 Hz) telemetry, and you must manage player privacy alongside the danger of misinterpreting injury indicators.
Beyond cost and privacy, you face technical and legal hurdles: inconsistent sampling rates, limited battery life for high-sample sessions (commonly 2-8 hours), and absence of interoperability standards create synchronization issues between video and sensor streams; plus automated injury-risk scores can create liability if used without validated models, clear consent, and secure data pipelines.
To wrap up
Now you see how smart tech and innovation in lacrosse sharpen your skills, inform your training and in-game strategy, reduce injury risk through data-driven monitoring, and expand fan engagement with immersive analytics; adopting these tools lets coaches and players make faster, evidence-based decisions that elevate performance while preserving the sport’s fast-paced spirit.
FAQ
Q: What smart technologies are currently used by lacrosse players and teams?
A: GPS trackers, inertial measurement units (IMUs) and heart-rate monitors provide movement, speed, acceleration and physiological load data; sensor-equipped sticks measure shot speed, release angle and ball contact events; smart helmets and mouthguards capture head-impact kinematics; high-frame-rate and multi-angle video systems enable automatic event tagging and tactic analysis; and cloud-based athlete-management platforms aggregate these sources for training planning, recovery monitoring and performance reporting.
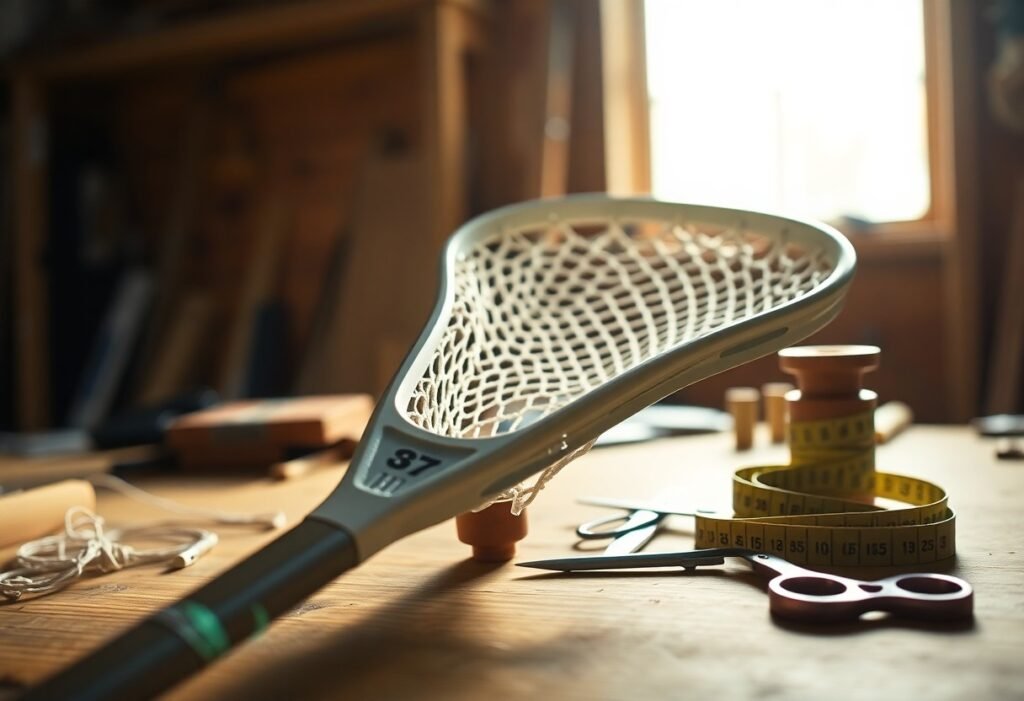
Q: How do sensor-equipped lacrosse sticks work and what actionable metrics do they deliver?
A: Miniature IMUs and pressure/contact sensors embedded in the shaft or head record linear and angular accelerations, rotational velocity and impact moments, plus timing of ball release and catches. Firmware and companion apps convert raw signals into metrics like shot speed, release point, whip/torque, shot consistency, pass accuracy and stick-handling smoothness. Coaches use these metrics to correct technique, structure drill progressions and quantify improvements; teams evaluate durability, sampling rate and waterproofing when selecting systems.
Q: Can smart helmets and mouthguards help detect or prevent concussions, and how are they integrated into workflows?
A: Impact sensors measure linear and angular acceleration and log events that exceed configurable thresholds, generating real-time alerts to sideline staff and populating impact histories for each athlete. Integration typically feeds alerts into athlete-management software for follow-up assessment, baseline comparisons and trend analysis of head-impact exposure. These tools support faster identification of concerning impacts but do not replace clinical evaluation; protocols should combine sensor data with standardized clinical screening and qualified medical oversight.
Q: What does AI and video analytics enable for lacrosse coaching, scouting and game planning?
A: Computer vision and machine-learning models automate player tracking, event detection (saves, goals, turnovers), possession timelines and heat maps of player movement. Analytics can identify offensive and defensive patterns, quantify decision-making and predict high-probability scoring opportunities. For scouting, AI can extract objective performance indicators across large video libraries and generate highlights or comparative reports; accuracy depends on camera quality, annotation quality and ongoing human validation.
Q: What data-privacy, ownership and ethical issues should teams and players consider with smart lacrosse tech?
A: Clarify data ownership and usage rights in contracts-athletes, teams and vendors must agree who can access, share and monetize the data. Implement informed consent, secure transmission and storage (encryption, access controls), retention and deletion policies, and compliance with applicable laws (GDPR, CCPA). Pay special attention to minors, recruiting practices and de-identified data sharing; establish governance for third-party research access and transparent policies on how analytics influence selection, discipline or medical decisions.